
Buying a property in England is not easy. You could say it isn't easy…
Who read the England’s Puzzle blog in 2017?
As we enter into 2018 I think it is time I had a look at the blogs performance in the last 6 months. (Indeed, it has been up and running for 6 months already…) I thought, results might not be interesting for me only but readers would also be keen to know which posts were the top 10 posts, who visited the site and other details that are available in the analytics. I must admit, I love preparing analyses at work, I find it exciting to see patterns, trends because it allows us to understand the business better and also highlights improvement areas. Although I am still in the learning phase of anlysing insights using data from Google Analytics, Jetpack and Facebook, I think I am alright with the basics.
So let’s see the blogs statistics and who read the England’s Puzzle blog in 2017!
It is clearly visible that the big boom was in June when I started the blog and notified friends and family about it. Unfortunately, shortly after that the blog declined due to family issues and started to pick up in October. The blog had the most traffic in November and December probably due to popular content and the fact I put some people on the newsletter. I was surprised how many of them were pleased to receive the newsletter, to which subscription was available since the start. The reason I refrained from adding people to the newsletter was because it is not ethical. Subscribers should subscribe themselves, but some people let me know they did not receive it although they subscribed. Anyway, I am pleased posts reach out to more and more people and if somebody does not like receiving the newsletters, unsubscribe is possible anytime. 🙂
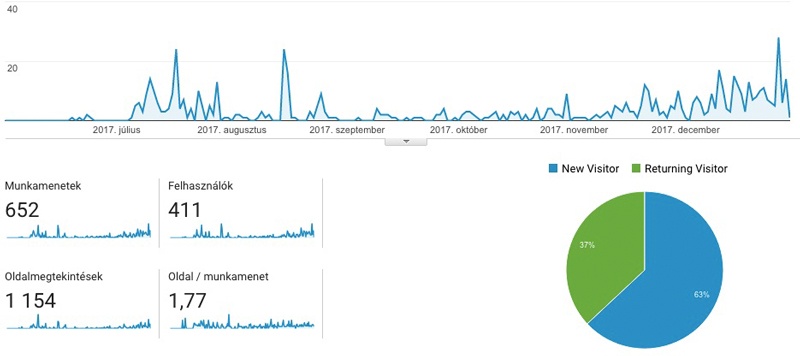
As far as the number of page views is concerned, during the 6 months I had 1154 which is peanuts compared to professional bloggers who have ca 160K page views per month. But I am not in despair, I am pleased for every result and the data helps me to improve and to set new goals. I find it interesting the percentage of new visitors (63%).
Visitors were from 31 countries in total, list is below.
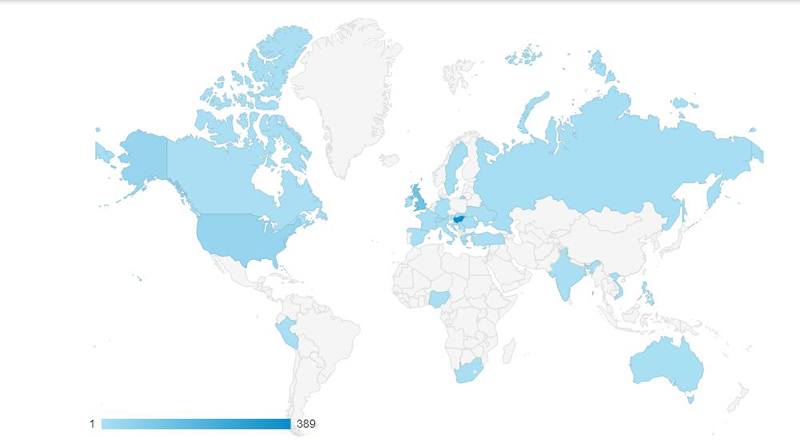
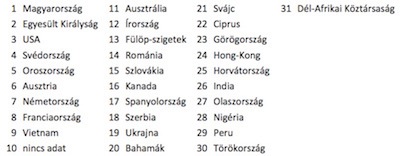
Interesting, isn’t it? Especially that no English version exist yet. 🙂
The top 10 posts were:
01. What is that black and white lamppost with an amber-coloured globe on top?
02. What is HP sauce?
03. The Full English breakfast
04. Belfast or London sink?
05. English Christmas 1 – Evergreens
06. English cheesecake
07. English Christmas 2 – Traditions
08. Christmas feeling with Grimm’s fairy tales
09. A baroque house with a love story – Ashdown House
10. The Butler
I still cannot believe the top 1 post is the one about the Belisha-Beacon. I am not surprised that Christmas posts were popular, as I worked a lot on them and perhaps I managed to provide interesting reads. On Facebook, however, posts about food are the most popular. I am aware, food is one of the most popular topics, but I do not want to change for a gastro-blog style, even though architecture is less attractive – which is my passion, not my profession. I do not want to give up my concept, but I take into consideration what the audience is interested in. My view and comments regarding the architecture are more aimed at helping readers to identify the differences and view the buildings in a different way when walking around towns and cities anywhere in the world.
I am pleased about the average loading time of the page which is 6,78 seconds. I was worried about it few months ago but it should be OK now. (It is amazing that Google Analytics provides data at this depth.) The time spent on the site improved as well it is 2:06 minutes. This is very important because the more time spent on site, the better Google rating it gets. (Remark: Still have not earned a single penny.)
And who are the Readers?
I was surprised to be honest that 54% of the readers are male readers and 46% female. The majority of the readers are between age 25-34 years followed by 18-24. I am please I have readers outside my network. The busiest day seems to be Monday in terms of traffic.
Below is some feedback from You, the readers:
“I read two blogs only. One of them is yours. It is very professional and has a beautiful design.”
“I think the blog is great. When I am reading your posts, the first thing pops to my mind is if I was English, I would love to read things like this.”
“Your posts help me in the most incredible way I never considered. Thank you.”
“I read your blog with pleasure. Your posts are interesting and it comes through how much you work on every post.”
“The blog has a very high quality and leads us to a magical world (it felt like as if I had been in England – the photos and texts are great).”
“Your blog is great, I read all posts.”
“The latest post was very interesting. Did you write it on your own? I must admit, it contained a lot of new information for me and I was amazed.”
And last but not least a few goals for 2018:
01.
Transfer the blog into English – the biggest project for 2018 for the time being. It would open it up and could get more readers. For this I have to translate existing posts and drafts as well. For this I am going to use a plugin which may help, but requires manual adjustments.
02.
Build a community – I have to be more active on Social Media.
03.
Write, write and write – the topic lays in the street as we say, I am full of ideas.
04.
Find the balance between the length of posts and improve style – some readers prefer shorter posts with more photos. I have to consider this as well.
05.
Surprise…
The rest we will see…:)
Related Posts
Comments (0)